Gain visibility into how learning drives performance — track progress, measure impact, and turn insights into actions that fuel growth.

Make Every Learning Moment Count with Data that Drives Real Growth
Our analytics turn every learning experience into measurable outcomes — helping you track progress, close skill gaps, and connect learning directly to business performance.
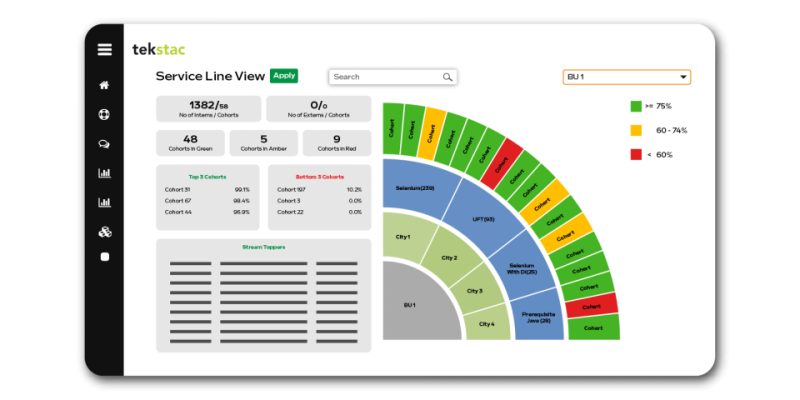
ROI Dashboards
We deliver the best solution and provide a business strategy that makes you a full professional.
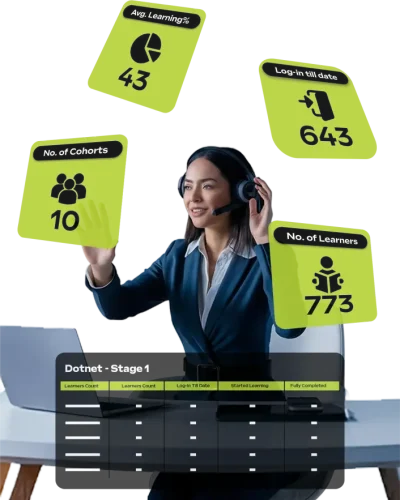
Engagement Insights
Get opportunity to gain technological skills that improve the innovation funnel with new tips & tricks.
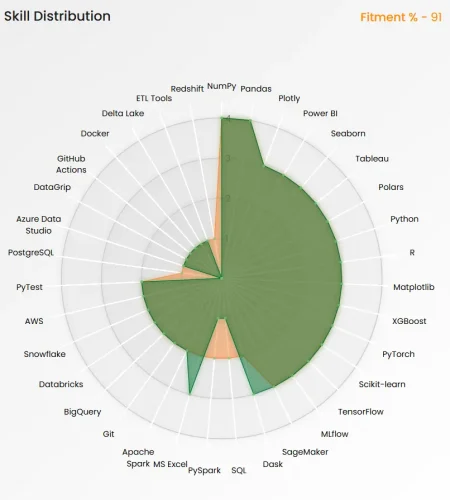
Skills Gap Analytics
It reveals capability gaps across roles and teams, helping you target learning where it matters most. Enable L&D and HR with data-driven development.
Translate Learning into Business Value
What it Covers?
Cost vs Value: Compare training spend vs real performance impact.
Time-to-Competency: Measure how fast learners reach job-ready skill levels.
Project Readiness: Identify who is deployment-ready and aligned to project needs.
KPI Linked Outcomes: Connect learning results directly to business KPIs.


Turn Engagement Data into Performance Power
What it Covers?
Role-Based Skill Mapping: Identify required skills per role and compare learner fit.
Gap Heatmaps: Visualize missing skills across teams to prioritize critical gaps.
Pre vs Post Learning: Measure how training closes gaps and where improvement is still needed.
Proficiency Levels: Track depth of skill mastery — from basic to advanced.
Close Skill Gaps Before they Cost You
What it Covers?
Activity Analytics: Track time spent, completion, repeat visits, logins, and quiz participation.
Drop-Off Analysis: Spot where learners disengage so you can optimize flow and formats.
Content Effectiveness: Identify which content types perform best and which need improvement.
Learner Sentiment: Measure satisfaction and motivation through ratings, comments, and surveys.

Frequently Asked Questions
How do ROI dashboards help demonstrate the value of learning programs?
ROI Dashboards connect learning outcomes directly to key business KPIs such as productivity, revenue growth, or quality improvement. They provide visibility into cost vs. value, time-to-competency, and project readiness.
What kind of insights can skill gap analytics provide?
Skill Gap Analytics identify which capabilities are missing across roles or teams and measure how effectively learning is bridging those gaps. With visual heatmaps, proficiency tracking, and pre/post learning comparisons, organizations can prioritize critical skill areas for maximum performance impact.
How do engagement metrics improve learner experience and retention?
Engagement metrics track how learners interact with content — including time spent, drop-offs, and satisfaction levels. By understanding behavior and preferences, organizations can personalize learning paths, boost participation, and enhance overall learning effectiveness.
Can learning & performance metrics integrate with existing LMS or HR systems?
Yes. The metrics and dashboards can be integrated seamlessly with your existing Learning Management Systems (LMS), HRMS, or talent analytics platforms — enabling unified insights and data-driven decision-making across learning and performance functions.

